Data Visualization examples are depictions of environmental conditions, utilizing graphic expression to describe environmental situations. Within the graphic, Is it Hot in Here or is it Just Me? rising temperatures are shown on a burning globe, with a thermometer reading warming (hot!) conditions.
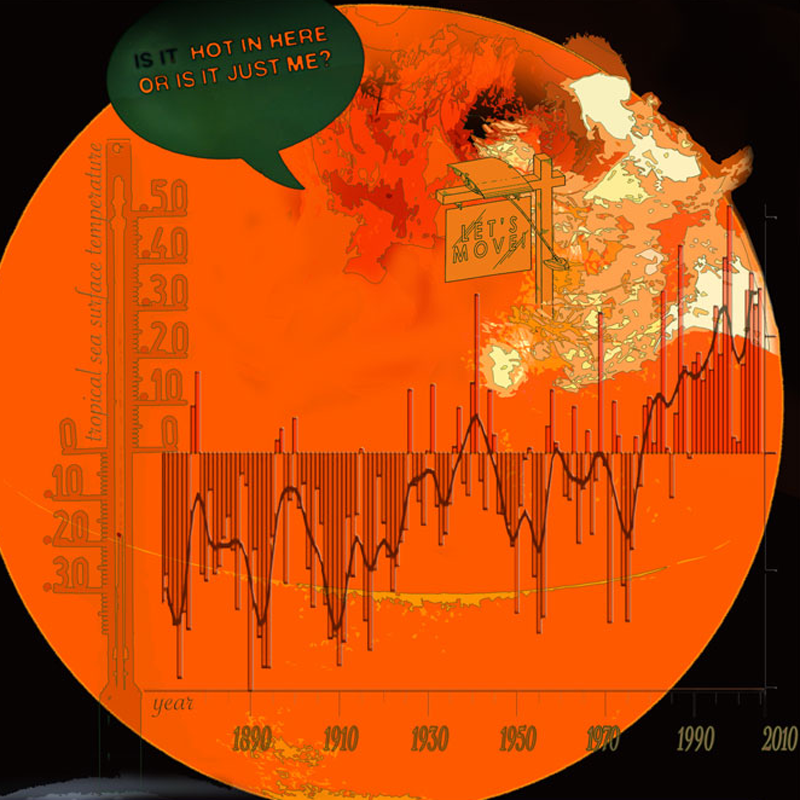
IS IT HOT IN HERE OR IS IT JUST ME?